The Wechsler IQ Test
The Wechsler IQ Test
There are many different IQ tests in the world, each with its own unique way of testing your intelligence and assessing how you measure up compared to others. The most well-known test, used by psychologists since the 1930s, is called the Wechsler Adult Intelligence Scale (WAIS).
This test, created by Wechsler in 1939, popularized the trend of using “deviation IQs” as standard scores and scales on which to measure IQ tests rather than the earlier adopted “quotient IQs” (“mental age” divided by “chronological age”) then used for the earlier Stanford–Binet test.
This deviation IQ scale for scoring IQ tests has become the current scoring method for all IQ tests in use. Using this IQ scale method means that an IQ score of 100 on a test indicates that a test-taker’s performance was at the median level for the sample of test-takers who were used to norm the test.
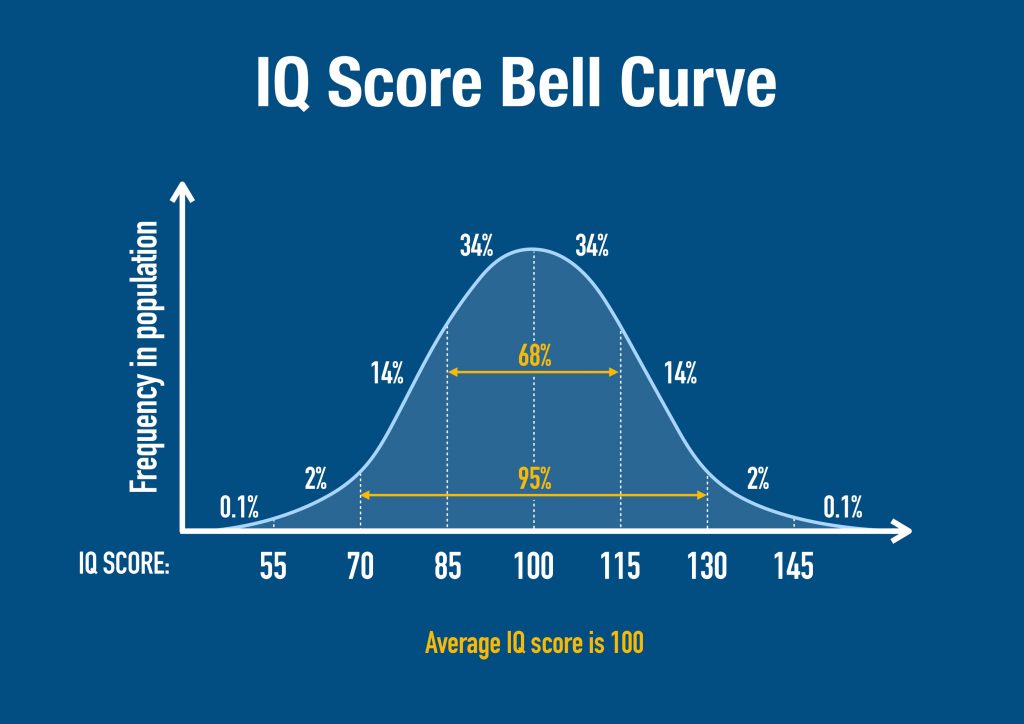
An IQ score of 115 on this IQ scale means that a test taker’s performance was one standard deviation above the median, while a score of 85, means the test taker performed one standard deviation below the median.
Deviation IQs are now used for all standard scoring of IQ tests and are the leading form of IQ scale. This is mainly as they allow for a consistent definition of IQ scores for both children and adults.
Using this deviation IQ scale, about two-thirds of all test-takers obtain scores from 85 to 115, and about 5 percent of the population scores above 125.
For the latest version of the Wechsler Intelligence Scale, the deviation IQ scale score translates as the following
- IQ score of 130 and above: Very Superior
- IQ score of 120-129: Superior
- IQ score of 110-119: High Average
- IQ score of 90-109: Average
- IQ score of 80-89: Low Average
- IQ score of 70-79: Borderline
- IQ score of 69 and below: Extremely low
What does a score on the Wechsler IQ Test show?
This distribution of scores when measuring the IQ of adults using the Wechsler IQ test is known as the bell shaped curve, which is a common type of distribution, known as the normal distribution.
When IQ scores from the Wechsler IQ test are plotted on a graph, they typically follow a bell-shaped curve. The peak of the “bell” occurs where the majority of the scores lie. The bell then slopes down to each side; one side represents lower than average scores and the other side represents scores that are above the average.
A number of standardised IQ tests have been developed over the years to help determine an Individual’s IQ score, and measure against a base line, or collective score, from measuring a large number of other people, with the Wechsler IQ test being one of the most famous.
The majority of these tests have found that an average IQ score is between 90 and 109. Below are some examples of the different ‘levels’ of IQ score, and where they place the individual when compared to their peers in a normal distribution such as the bell-shaped curve.

The different Versions of the WAIS
Over the years there have been various different iterations of the WAIS test, as the test has been improved and made more accurate.
These include:
WAIS (1955)
WAIS-R (1981)
WAIS-III (1997)
WAIS-IV (2008)
The most recent version of the WAIS was released in 2008 and includes ten core subtests as well as five supplemental subtests. Additionally, the WAIS-IV test provides four major scores in areas concerning –
Perceptual Reasoning
Processing Speed
Verbal Comprehension
Working Memory
While IQ tests like the Wechsler are designed to measure cognitive abilities and intellectual potential, they don’t capture the whole picture of who you are. To explore your core motivations, fears, and underlying personality structure, a different kind of framework is needed. You can discover this other side of yourself with our Free Enneagram Test.