IQ Bell Curve: The Ultimate Guide to Understanding Human Intelligence
A deep dive into the normal distribution of human intelligence, standard deviations, and the statistical reality of cognitive testing.
Introduction to the IQ Bell Curve
When we talk about intelligence, we often throw around numbers like 100, 130, or 145. But without understanding the IQ bell curve, these numbers are entirely meaningless. Intelligence Quotient (IQ) is not an absolute measurement of brain power, like inches on a ruler or pounds on a scale. Instead, it is a comparative metric. It tells you exactly where you stand relative to the rest of the human population.
- The IQ bell curve maps human intelligence relative to the general population.
- An IQ of 100 is the exact statistical average.
- Roughly 68% of the global population scores between 85 and 115.
- Different tests use different scales (e.g., Wechsler uses SD15, Stanford-Binet uses SD16), meaning a score of 130 means different things depending on the test.
The IQ bell curve—statistically known as a normal distribution—is the mathematical foundation of all modern cognitive testing. Whether you are taking the Wechsler Adult Intelligence Scale (WAIS), the Stanford-Binet, or a Mensa admissions test, your score is derived by plotting your raw performance onto this exact curve.
In this comprehensive guide, we will break down the mechanics of the IQ bell curve, explain the critical difference between SD15 and SD16, explore the historical context of intelligence distribution, and debunk common misconceptions about human cognition.
The Mathematics of Normal Distribution
To truly grasp the IQ bell curve, you must first understand the concept of normal distribution. In statistics, a normal distribution is an arrangement of a data set in which most values cluster in the middle of the range, and the rest taper off symmetrically toward either extreme.
Human intelligence, much like height, blood pressure, and natural athletic ability, naturally falls into this distribution pattern. The mathematical formula that creates this bell-shaped curve is the probability density function for the normal distribution:
The shape of the bell curve is defined by the following equation:
$f(x) = \frac{1}{\sigma\sqrt{2\pi}} e^{-\frac{1}{2}\left(\frac{x-\mu}{\sigma}\right)^2}$
Where $\mu$ is the mean (set to 100 for IQ) and $\sigma$ is the standard deviation (typically 15).
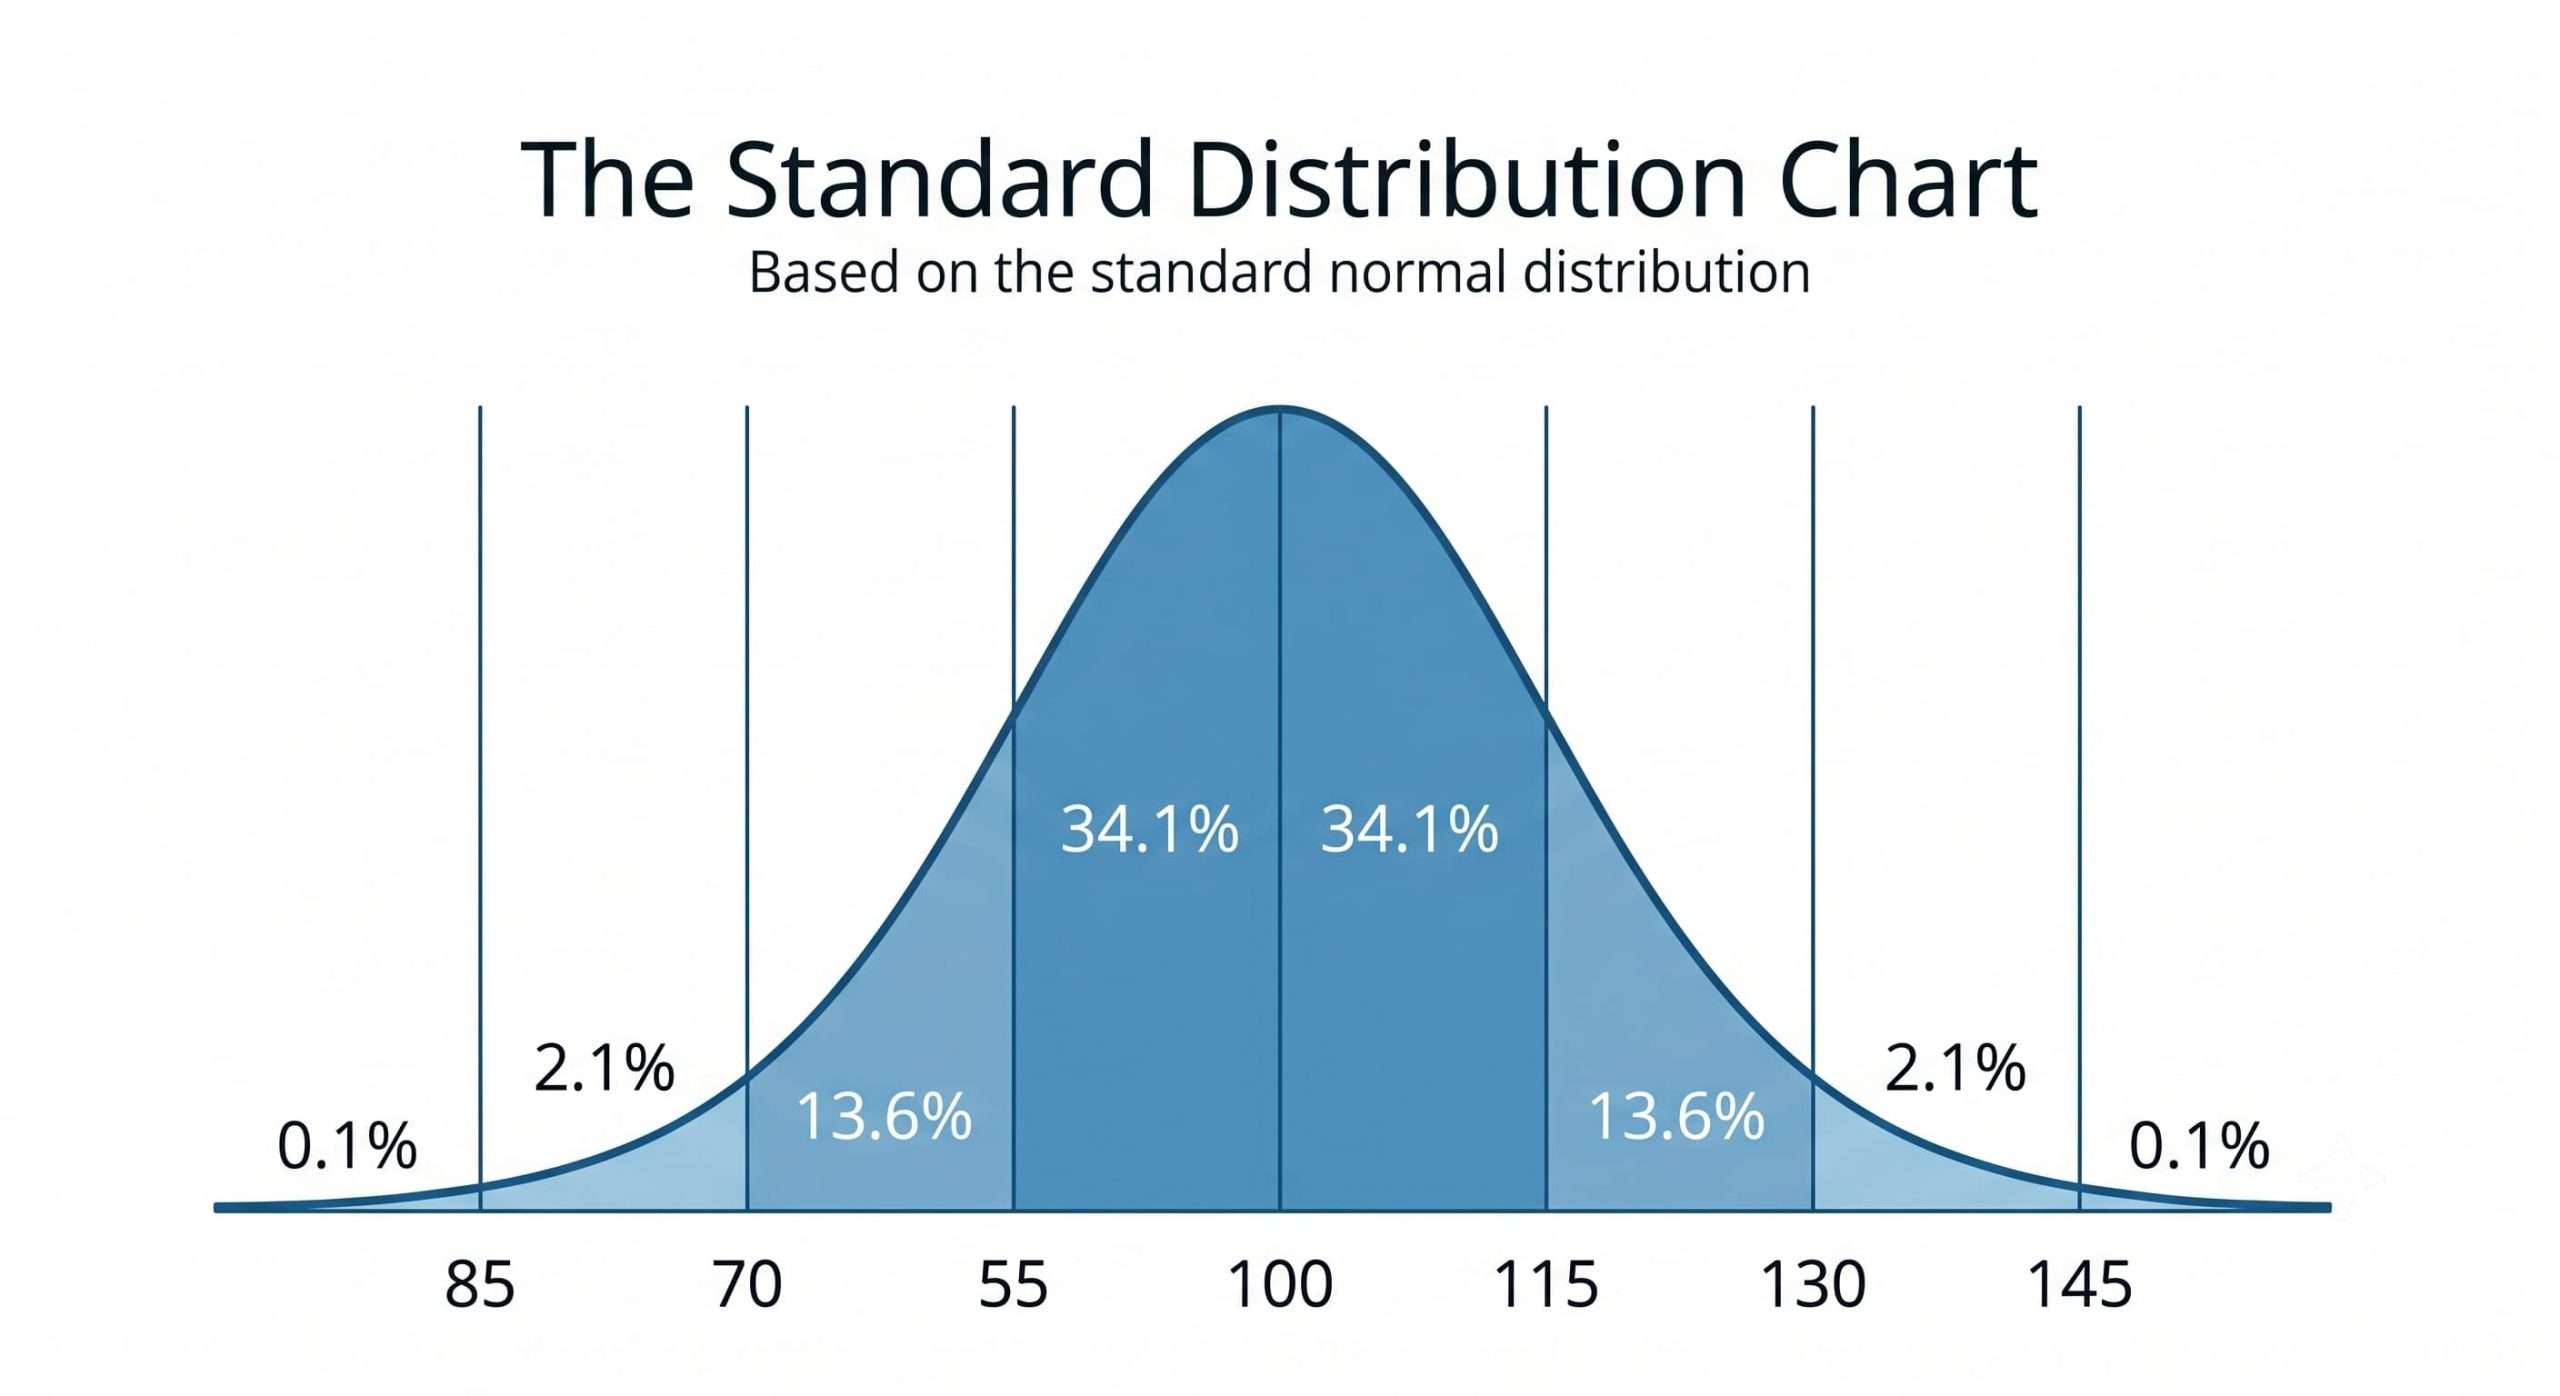
The 68-95-99.7 Rule (The Empirical Rule)
The beauty of the normal distribution is its predictability. In any standard bell curve, data always follows the Empirical Rule, also known as the 68-95-99.7 rule. Here is how it applies to an IQ test with a standard deviation (SD) of 15:
- 68.2% of the population falls within one standard deviation of the mean. This means roughly two-thirds of all human beings have an IQ between 85 and 115.
- 95.4% of the population falls within two standard deviations. This spans from an IQ of 70 to 130.
- 99.7% of the population falls within three standard deviations. This covers the extreme ranges from 55 to 145.
Anyone scoring outside of these bounds—below 55 or above 145—is a statistical anomaly, representing a tiny fraction of a percent of the global population.
Breaking Down the Intelligence Ranges
Psychologists use the standard deviations mapped on the bell curve to categorize cognitive abilities into distinct ranges. While labels have evolved over the decades to become more clinical and less pejorative, the underlying statistical brackets remain the same.
1. The Average Range (IQ 85 - 115)
This is the thickest part of the bell curve. If you score exactly 100, you are at the 50th percentile—meaning you scored higher than half the population and lower than the other half. People in this range possess the cognitive capacity to graduate high school, complete standard college degrees, and function perfectly in the vast majority of professions.
2. High Average to Superior (IQ 115 - 130)
Moving one standard deviation to the right puts you in the "High Average" and "Superior" brackets. This represents about 14% of the population. Individuals in this range often excel in academic environments. You will find a high concentration of professionals—managers, teachers, accountants, and engineers—operating comfortably within this cognitive bandwidth.
3. Very Superior / Gifted (IQ 130 - 145)
At an IQ of 130 (SD 15), you cross the threshold into the top 2% of the population. This is the traditional cutoff for high-IQ societies like Mensa. The cognitive processing speed, pattern recognition, and working memory of individuals in this range are exceptionally high. They are statistically rare, representing roughly 1 in 50 people.
4. Genius / Profoundly Gifted (IQ 145+)
Three standard deviations above the norm places an individual in the "Genius" or profoundly gifted category. At an IQ of 145, you are looking at a rarity of 1 in 741 people. At 160, the rarity jumps to 1 in over 30,000. These individuals often possess the raw cognitive horsepower to push the boundaries of theoretical physics, advanced mathematics, and complex philosophical paradigms.
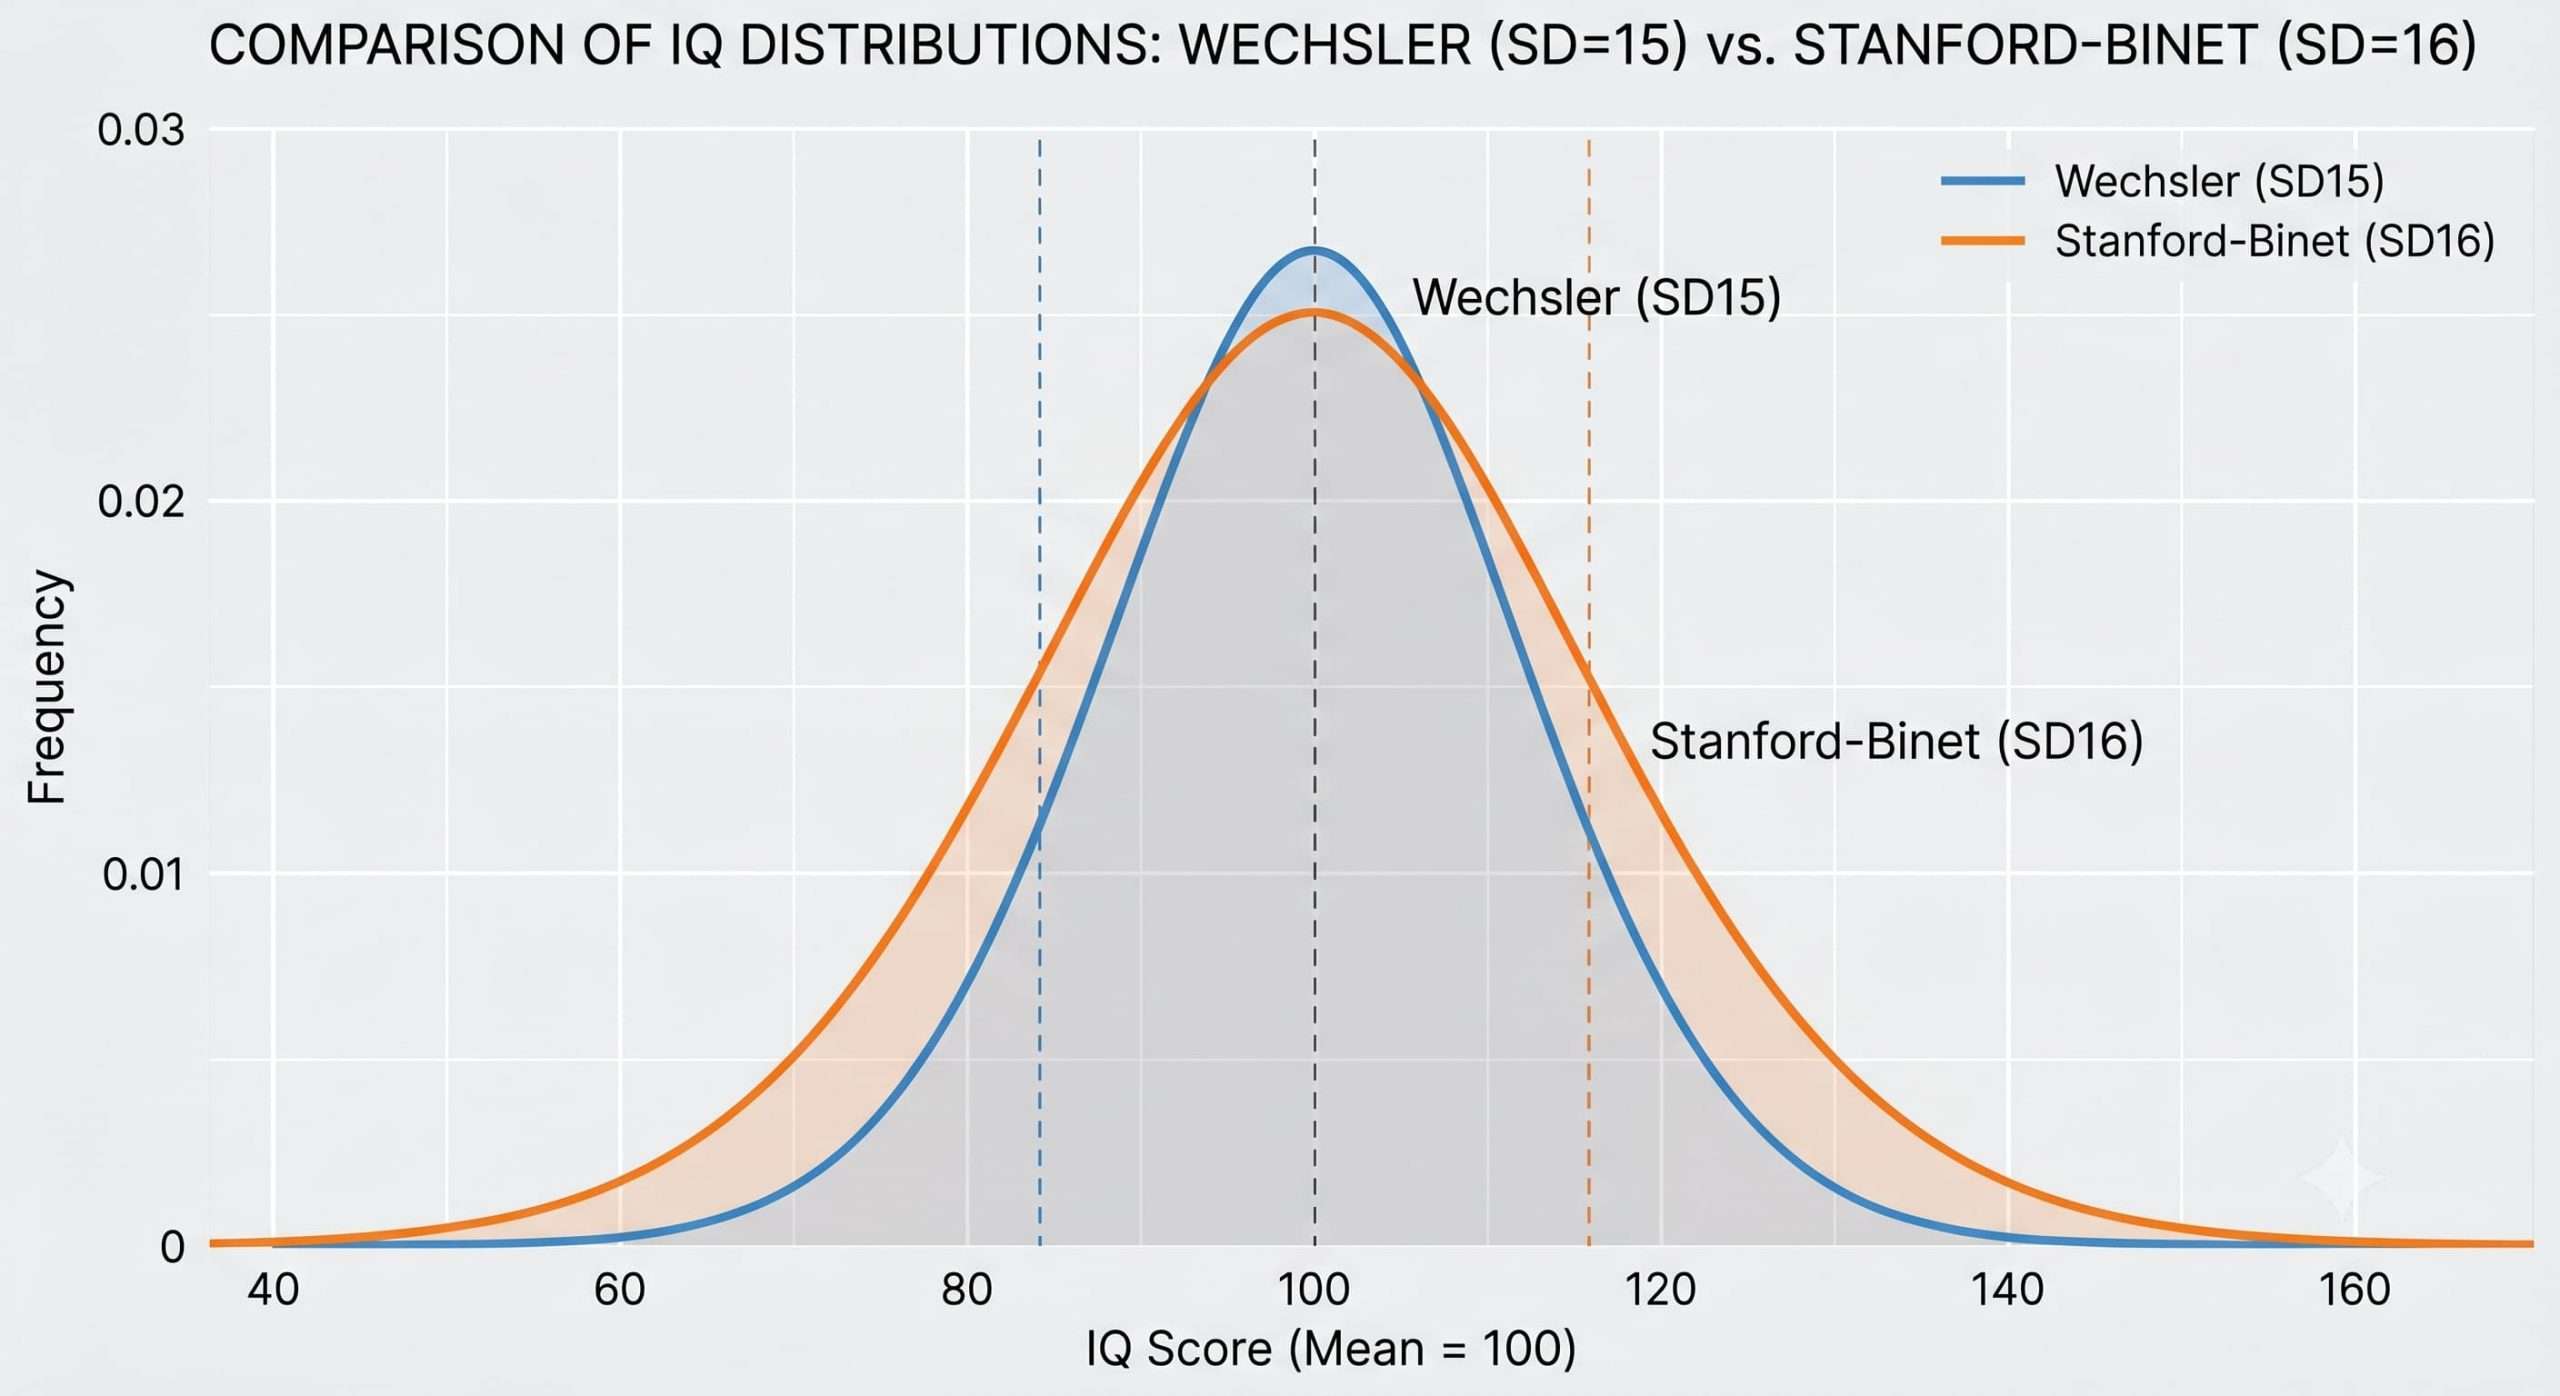
The Crucial Difference: SD 15 vs. SD 16
One of the most confusing aspects of the IQ bell curve for laypeople is the difference between standard deviations. Not all IQ tests use the same scale, which means an IQ of 140 on one test is not statistically equivalent to an IQ of 140 on another.
The two most prominent scales are mapped below to show how drastically standard deviations affect high-end scoring:
| IQ Test Name | Standard Deviation (SD) | Score Needed for Top 1% |
|---|---|---|
| Wechsler (WAIS/WISC) | SD 15 | 135 |
| Stanford-Binet | SD 16 | 137 |
| Cattell | SD 24 | 156 |
Because the bell curve expands outward, the further you get from the mean of 100, the wider the gap becomes between these scales. For example, being in the 99.9th percentile requires a score of 146 on the Wechsler (SD15) scale. However, to reach that exact same rarity on the Stanford-Binet (SD16) scale, you need a score of 149.
If someone boasts about having an IQ of 160, your first question should always be: "On which scale?" If it was the Cattell scale (SD24), their 160 is statistically equivalent to a 137 on the Wechsler scale—a massive difference in rarity.
The Evolution of Intelligence Testing
The bell curve wasn't always applied to intelligence. The earliest intelligence test, created by Alfred Binet and Theodore Simon in 1905, was designed purely to identify schoolchildren in Paris who needed special educational assistance. They calculated an "intelligence quotient" by dividing a child's mental age by their chronological age and multiplying by 100.
This original formula ($IQ = \frac{Mental Age}{Chronological Age} \times 100$) worked moderately well for children but broke down entirely for adults. After all, a 40-year-old does not have twice the cognitive processing power of a 20-year-old.
It was David Wechsler in 1939 who fundamentally modernized intelligence testing. He abandoned the mental age quotient entirely and instead mapped human performance onto the Gaussian normal distribution. By fixing the average adult score at 100 and standardizing the deviation, Wechsler ensured that IQ scores would forever remain a statistical comparison against one's peers rather than a flawed biological age ratio.
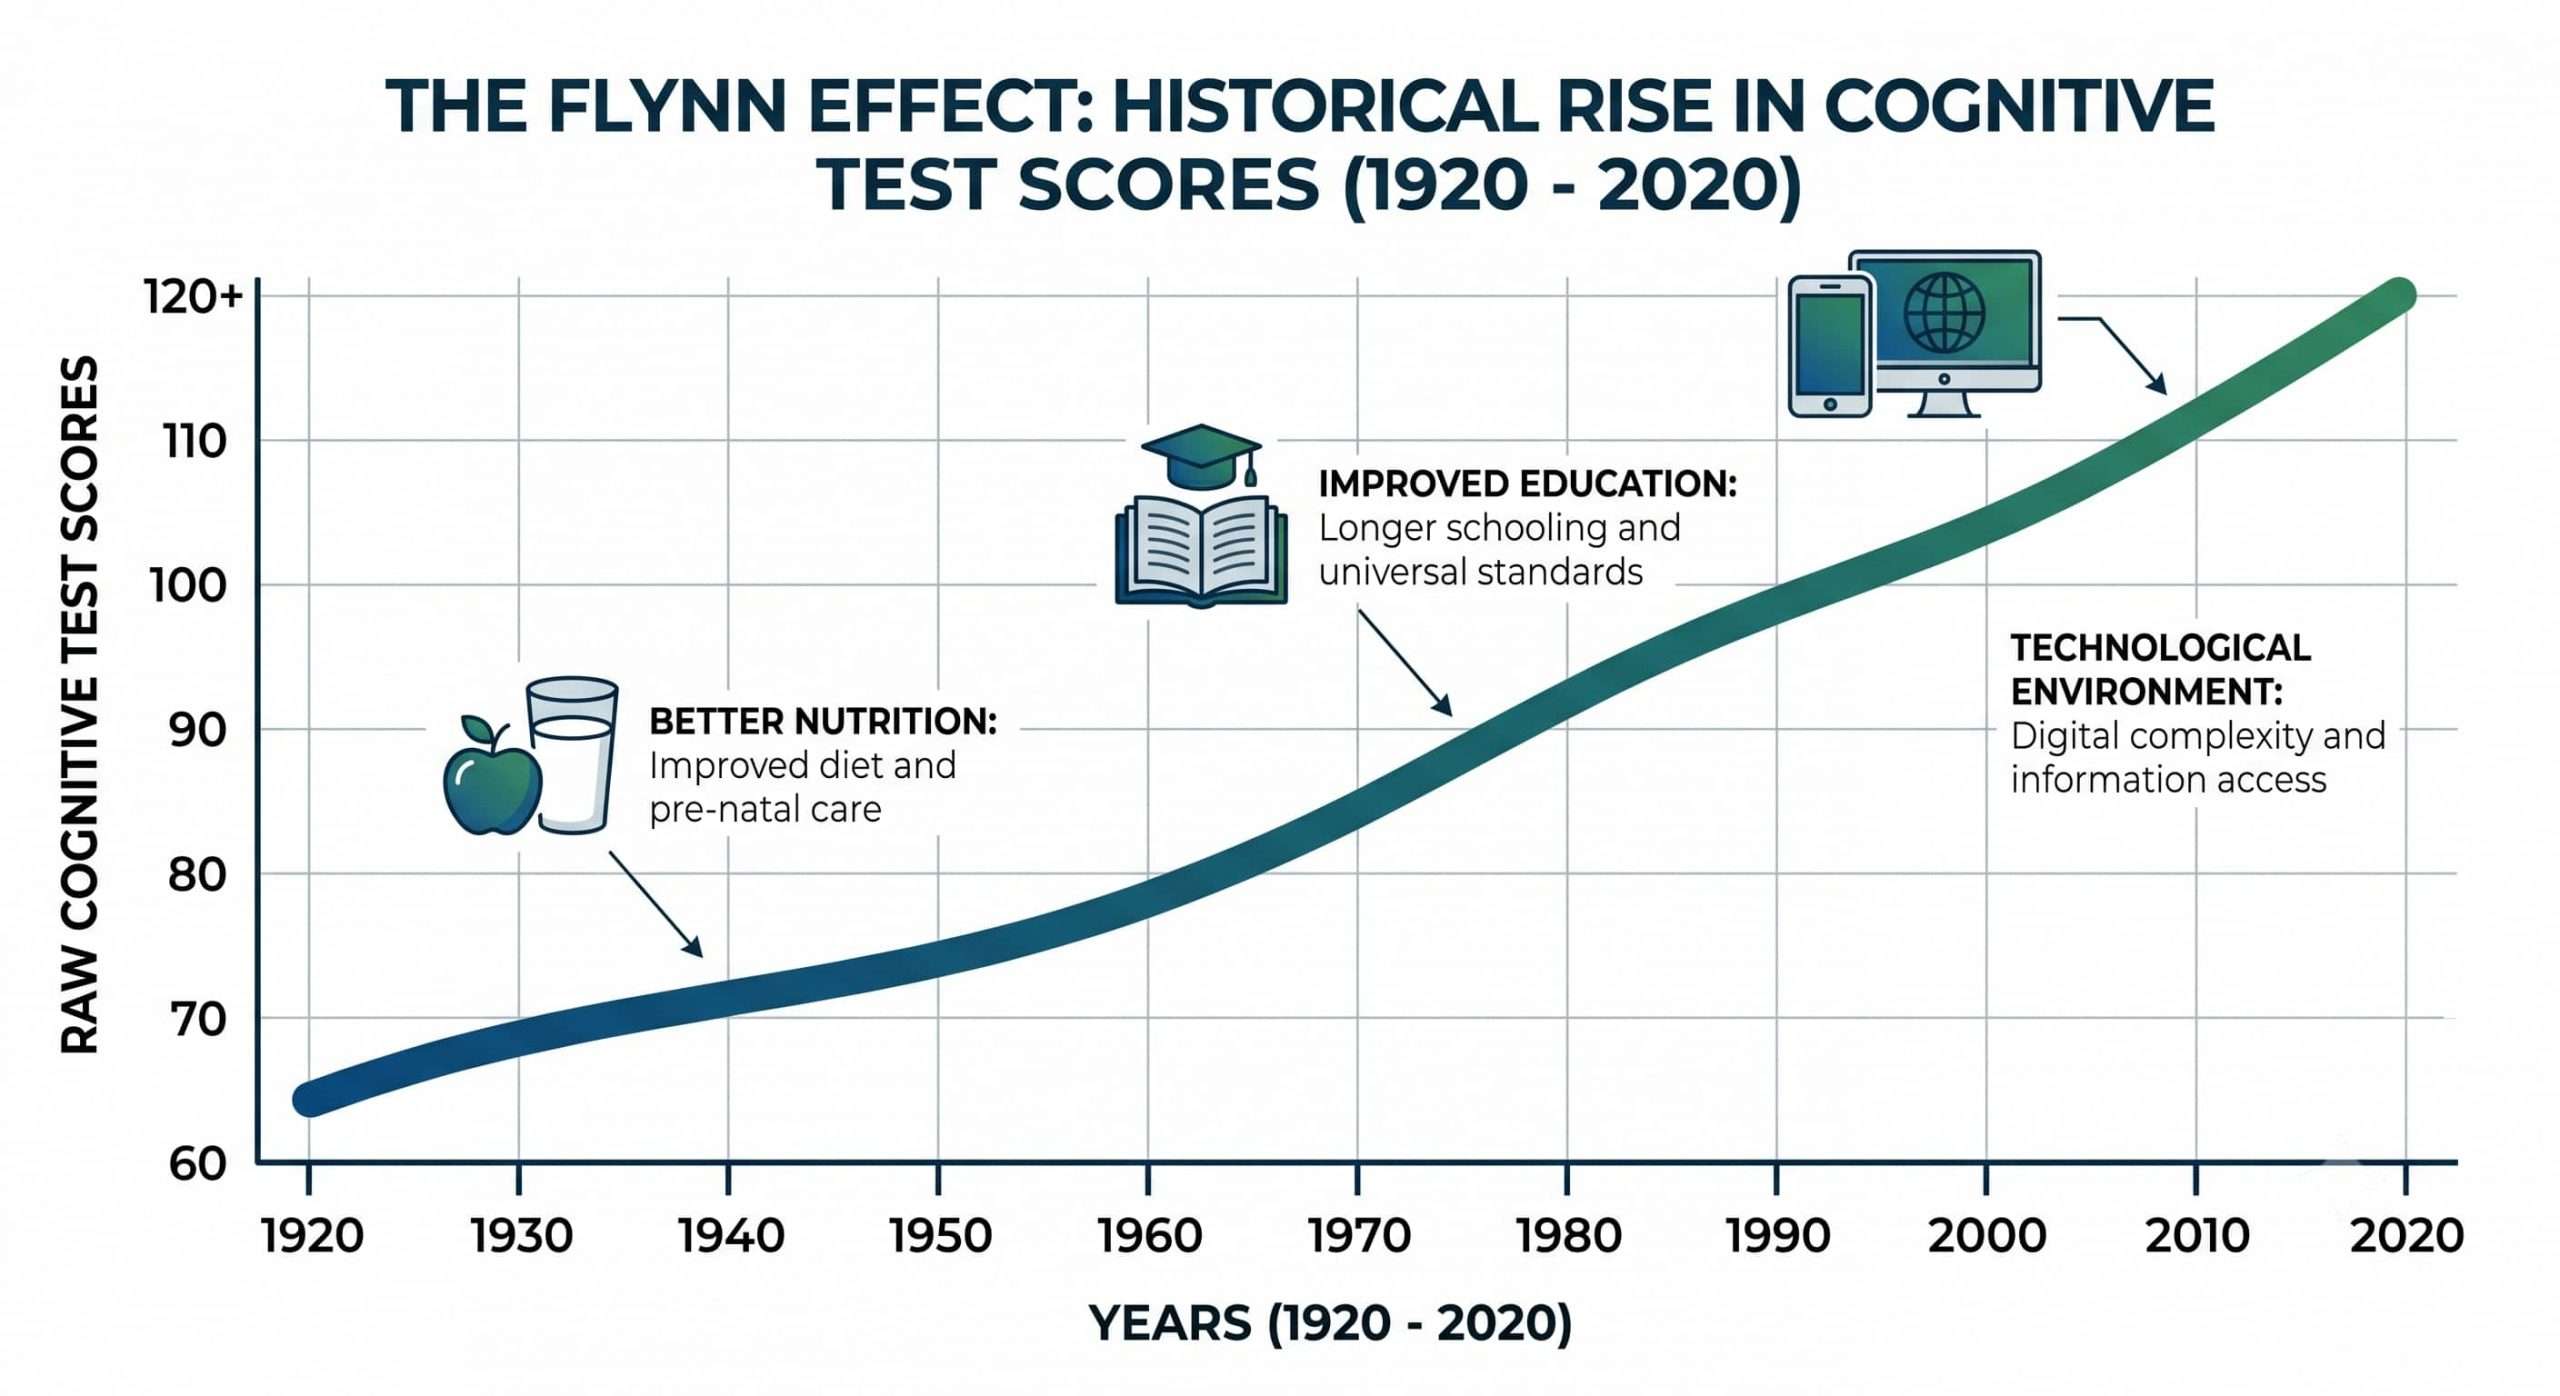
The Flynn Effect: A Moving Target
If intelligence is distributed on a fixed bell curve, an interesting problem arises: what happens if the human race as a whole gets smarter?
This phenomenon was documented by moral philosopher and researcher James Flynn, who noticed a peculiar trend in the 1980s. When older IQ tests were given to modern cohorts, the modern test-takers scored substantially higher than the original norming group. In fact, raw intelligence scores were rising by roughly 3 points per decade throughout the 20th century.
This is known as the Flynn Effect. The underlying causes are highly debated but generally attributed to:
- Better Nutrition and Health: Reduction in childhood diseases and better pre-natal care allowed brains to develop to their full genetic potential.
- Increased Formal Education: Longer, more rigorous schooling trained the brain in the abstract, taxonomic thinking that IQ tests measure.
- A More Complex Environment: The modern world requires navigating complex visual, technological, and bureaucratic systems, effectively providing daily "cognitive workouts" that our ancestors didn't experience.
Because of the Flynn Effect, IQ tests must be frequently "re-normed." Every few years, test creators gather a new sample of the population, administer the test, and reset the raw score average back to a perfect 100 on the bell curve. This ensures that an IQ of 100 remains statistically average for the current generation.
Nature vs. Nurture: Where Do You Fall on the Curve?
Where an individual lands on the IQ bell curve is a product of both genetics and environment. Behavioral genetics studies, particularly those involving identical twins separated at birth, show that the heritability of intelligence is significant.
However, genetics merely set the upper and lower bounds of your potential on the curve. Environment dictates where within that range you actually end up. Severe malnutrition, chronic stress, or lack of educational stimulation during critical developmental windows can push a child downward on the curve. Conversely, a highly enriched environment maximizes genetic potential.
Interestingly, the heritability of IQ increases with age. While childhood environment has a massive impact on early IQ scores, adults gain more autonomy to choose environments that align with their genetic predispositions, making adult IQ scores heavily reliant on natural cognitive traits.
Common Misconceptions About the IQ Bell Curve
Despite its mathematical precision, the IQ bell curve is frequently misunderstood. Let's address some of the most common fallacies:
Misconception 1: The Curve Measures "Human Worth"
IQ tests measure a very specific type of cognitive ability: primarily fluid reasoning, visual-spatial processing, working memory, and quantitative logic. The bell curve does not measure creativity, emotional intelligence (EQ), moral integrity, charisma, or street smarts. It is entirely possible to be on the extreme right of the IQ bell curve and still struggle profoundly in social or practical life.
Misconception 2: Scores Are Permanent and Immutable
While an individual's rank on the bell curve remains relatively stable throughout adulthood, it is not etched in stone. Extreme fatigue, depression, anxiety, or lack of familiarity with the testing language can temporarily lower a score. Likewise, intensive training in specific working-memory tasks can yield slight, temporary bumps in performance, though long-term "brain training" gains rarely transfer to general intelligence ($g$).
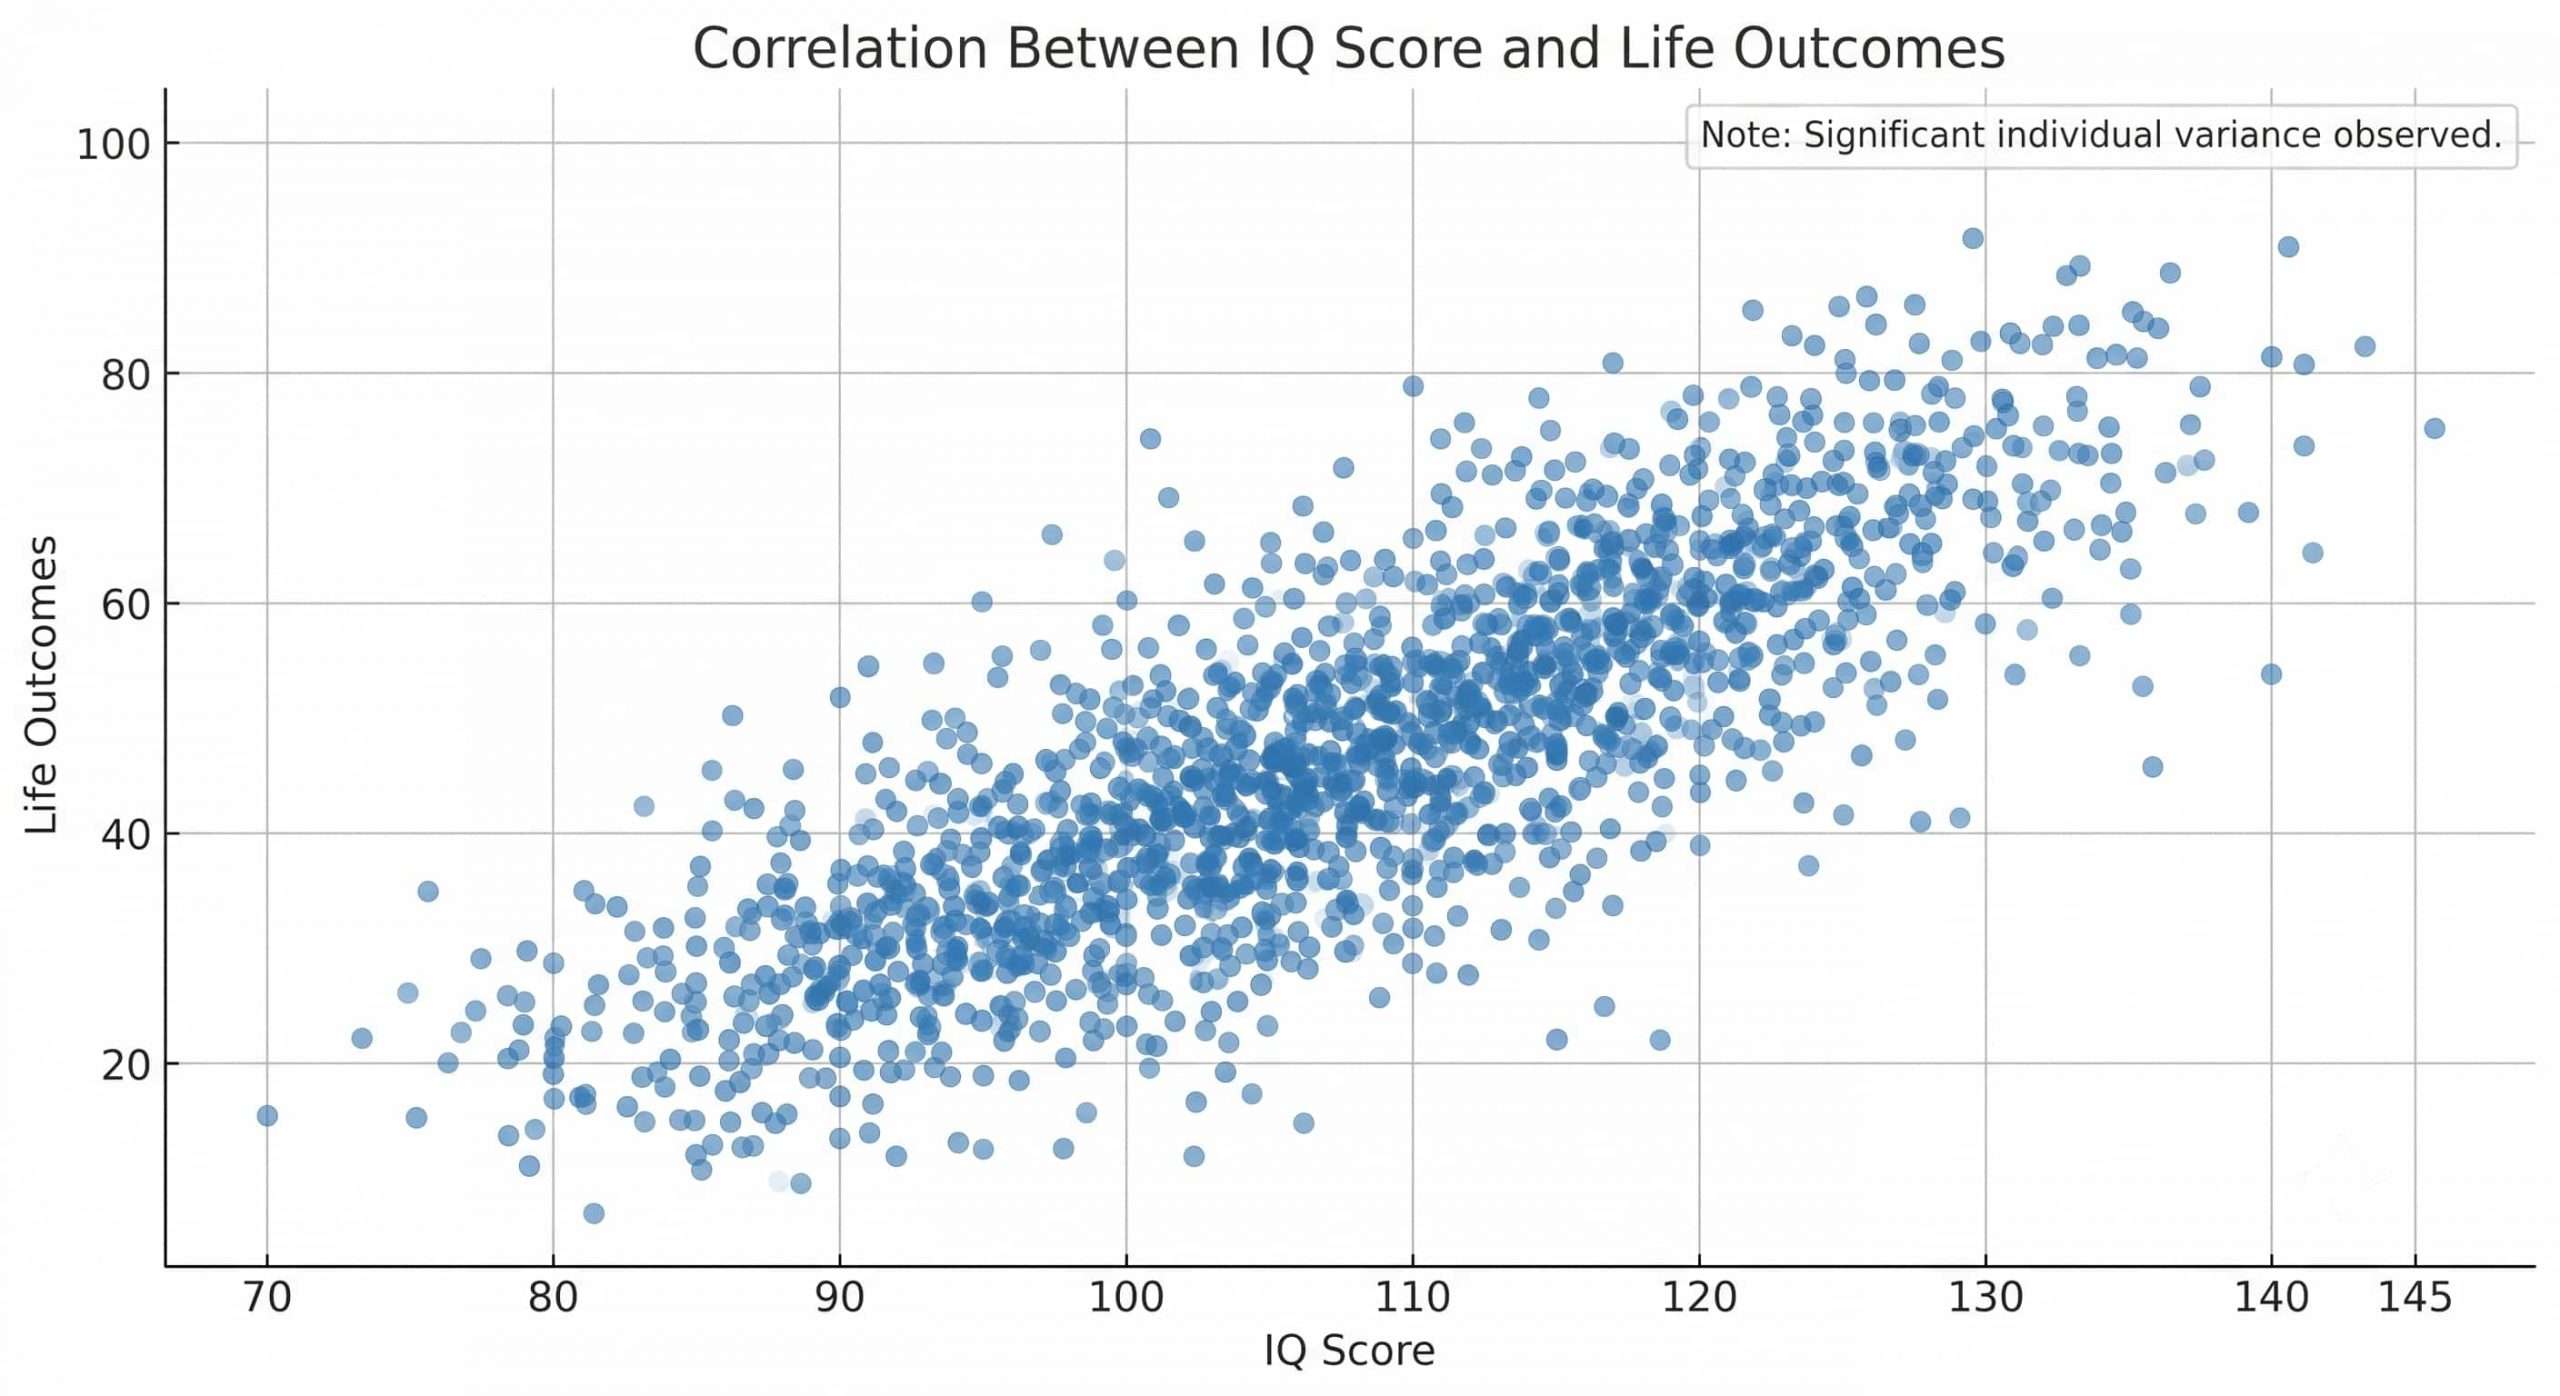
Misconception 3: You Must Be In The Top 1% to Succeed
The correlation between IQ and real-world success (income, career attainment) is positive but not absolute. The threshold hypothesis suggests that once an individual reaches an IQ of around 115-120 (capable of handling rigorous university study), other traits like conscientiousness, grit, and social skills become far more predictive of outstanding success than additional IQ points.
Frequently Asked Questions (FAQ)
A normal, or average, IQ score is defined as exactly 100. However, the "normal range" encompasses anyone scoring between 85 and 115 on an SD15 test, which covers roughly 68% of the global population.
The higher you go on the bell curve, the less accurate the tests become. Because scores above 145 represent less than 0.1% of the population, it is incredibly difficult to find enough people to "norm" the test accurately at those extremes. Standard IQ tests lose precision above 145.
It provides a standardized, objective framework for diagnosing intellectual disabilities, qualifying students for gifted education programs, and conducting clinical neurological assessments following traumatic brain injuries.
Conclusion
The IQ bell curve is a triumph of statistical modeling, allowing us to map the invisible landscape of human cognition. By standardizing scores across a normal distribution, psychologists have created a robust framework for comparing cognitive abilities, tracking generational shifts via the Flynn Effect, and tailoring educational resources to those who need them most.
However, it is crucial to remember that while the bell curve is an excellent tool for measuring specific analytical and logical processes, it is only one slice of the human experience. Intelligence is a complex, multi-faceted trait, and your position on the curve defines your cognitive processing speed, not your ultimate potential for a fulfilling and impactful life.


 & Traits")
