IQ Score Chart: Full Range, Classifications & Percentiles (2026)
An IQ score is easier to understand when you can compare it with other scores.
This IQ score chart shows the main IQ ranges, classifications, percentiles and
where each score sits compared with the average IQ of 100.
Don't have a score yet? Take our
free IQ test online
for an instant result, then return here to see how it compares.
The IQ Score Chart
Most modern IQ scales are standardized around an average score of
100 with a standard deviation of approximately
15 points. That means scores become progressively less
common as they move farther above or below 100.
IQ Range
Classification
Approx. Percentile
Approx. Share
145+
Very Superior / Exceptionally High
99.9th+
~0.1%
130–144
Very Superior
98th–99.9th
~2.1%
120–129
Superior
91st–98th
~6.4%
110–119
High Average
75th–91st
~16.1%
90–109
Average
25th–75th
~50.0%
80–89
Low Average
9th–25th
~16.1%
70–79
Borderline
2nd–9th
~6.4%
Below 70
Extremely Low
Below 2nd
~2.2%
Classification terminology can vary between test publishers and editions.
The percentile figures above are rounded estimates based on a normal
distribution with a mean of 100 and standard deviation of 15.
IQ Score Comparison Chart: Compare Scores, Percentiles & Rankings
The chart above groups scores into broad ranges. This IQ score comparison
chart goes further by showing individual scores in 5-point intervals, their
approximate percentile and how far each score sits above or below the
average IQ of 100.
For example, an IQ of 115 is approximately one standard deviation above
average, while an IQ of 130 is approximately two standard deviations above
average.
IQ Score
Approx. Percentile
Compared With Average
General Range
70
2.3rd
30 points below average
Borderline
75
4.8th
25 points below average
Borderline
80
9.1st
20 points below average
Low Average
85
15.9th
15 points below average
Low Average
90
25.2nd
10 points below average
Average
95
36.9th
5 points below average
Average
100
50th
Average
Average
105
63.1st
5 points above average
Average
110
74.8th
10 points above average
High Average
115
84.1st
15 points above average
High Average
120
90.9th
20 points above average
Superior
125
95.2nd
25 points above average
Superior
130
97.7th
30 points above average
Very Superior
135
99.0th
35 points above average
Very Superior
140
99.6th
40 points above average
Very Superior
145
99.87th
45 points above average
Exceptionally High
150
99.96th
50 points above average
Exceptionally High
155
99.988th
55 points above average
Exceptionally High
160
99.997th
60 points above average
Exceptionally High
Percentiles are approximate and assume a normal IQ distribution with
mean 100 and standard deviation 15. Extreme scores should be interpreted
cautiously because test ceilings, norm samples and measurement error matter
more at the ends of the scale.
How Common IQ Scores Compare
One of the easiest ways to understand the IQ scale is to compare several
common reference scores side by side.
10050th percentile
Exactly average on a standard IQ scale.
110~75th percentile
Higher than roughly three quarters of the norm group.
120~91st percentile
About 20 points above the standardized average.
130~98th percentile
Approximately two standard deviations above average.
140~99.6th percentile
A statistically uncommon score on an SD-15 scale.
150~99.96th percentile
An extremely uncommon score on the standard distribution.
IQ Score Lookup: Compare Your Score
Enter an IQ score below to see its approximate percentile, classification
and distance from the standardized average of 100.
Enter a score from 40 to 180.
IQ 120
Approx. percentile90.9th
ClassificationSuperior
Compared with average20 points above
Standard deviations+1.33 SD
40100 average180
An IQ of 120 is approximately at the 90.9th percentile on an
SD-15 scale.
Scores below 90 are still part of the normal distribution.
Test conditions, measurement error and the specific instrument used
all matter when interpreting an individual result.
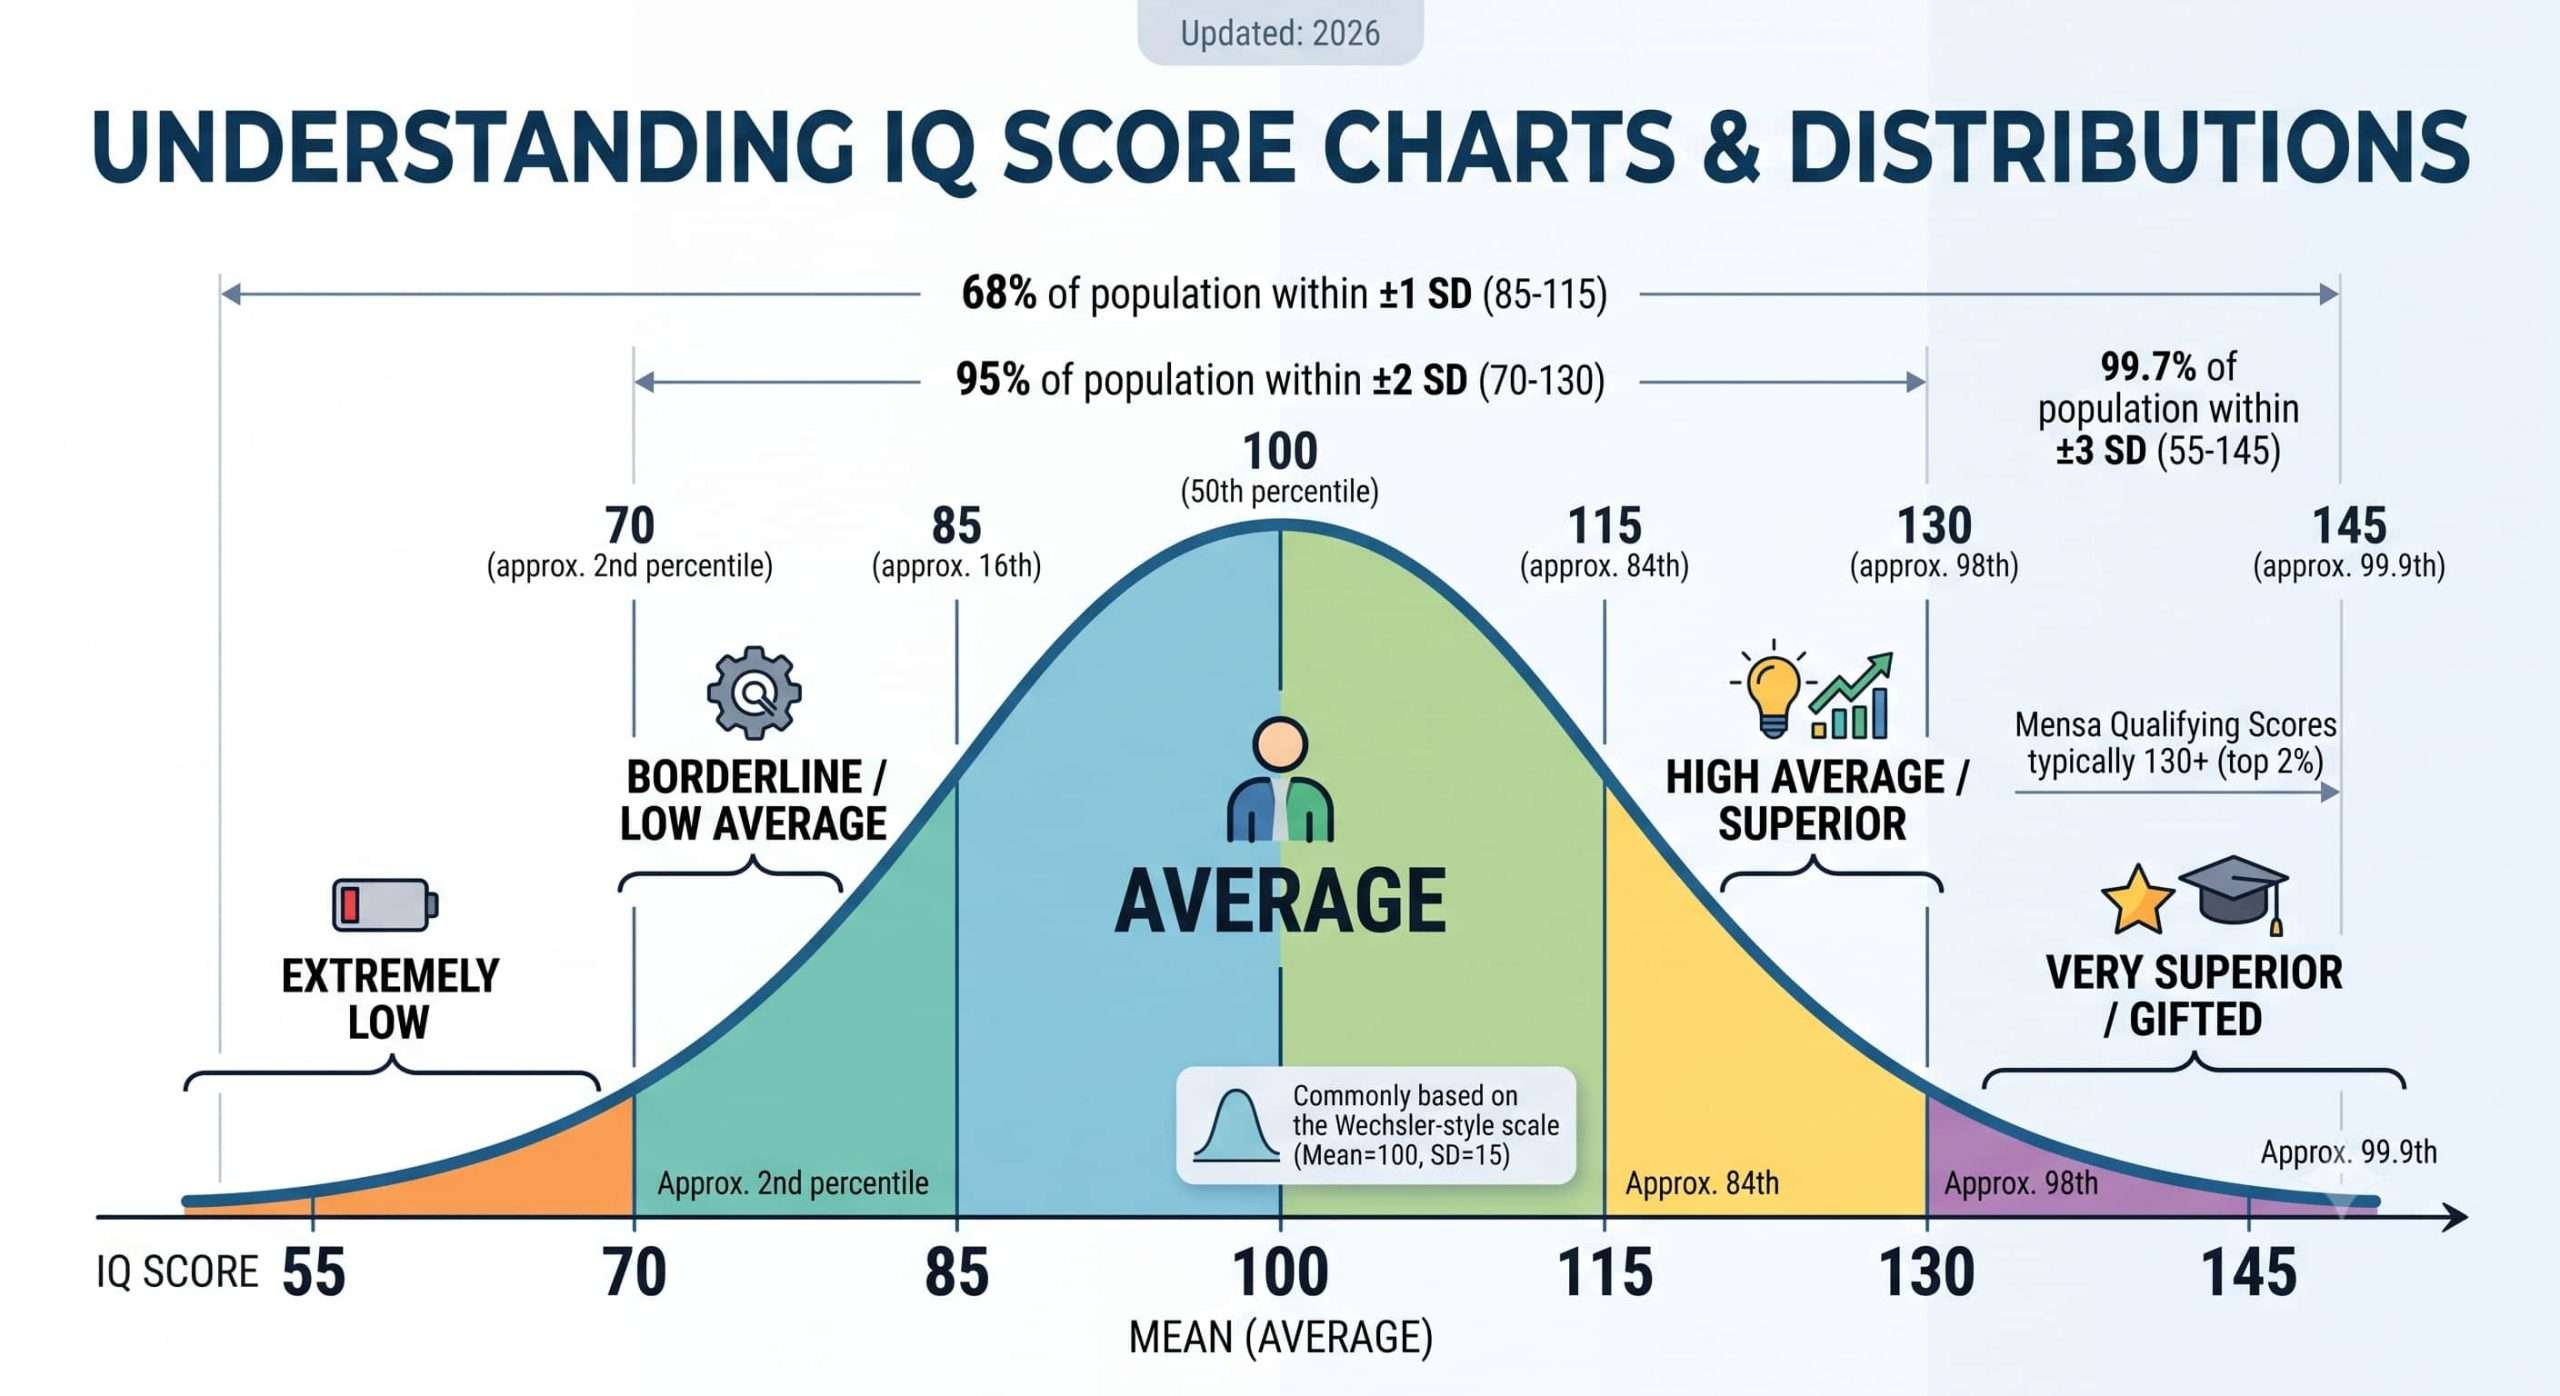
How IQ Scores Map to the Bell Curve
IQ scores are designed to follow an approximately normal distribution,
commonly called a bell curve. Most scores cluster near 100, while very
high and very low scores become progressively less common.
55
70
85
100
115
130
145
Around 68% of scores fall between
85 and 115, within one standard deviation of the mean.
Around 95% fall between
70 and 130, within two standard deviations.
Around 99.7% fall between
55 and 145, within three standard deviations.
For a dedicated visual explanation, see our
IQ Bell Curve
page.
IQ Score Comparison by Test Scale
Two IQ numbers are not always directly comparable. Different historical
tests and scoring systems have used different standard deviations, meaning
the same percentile can be represented by a different numerical IQ score.
Percentile
SD 15 Scale
SD 16 Scale
SD 24 Scale
50th
100
100
100
~84th
115
116
124
~91st
120
121
132
~98th
130
132
148
~99.6th
140
143
164
~99.87th
145
148
172
This is why an older test report and a modern report can contain different
numerical IQ scores while representing a similar percentile position.
The numerical difference between two IQ scores does not directly tell you
how common each score is. Percentile rank makes the comparison easier
because it shows the approximate percentage of the norm group scoring at
or below a particular level.
For example, moving from IQ 100 to IQ 115 is a 15-point increase, but it
corresponds roughly to moving from the 50th percentile to the 84th
percentile. Moving another 15 points to IQ 130 corresponds to roughly the
98th percentile.
This is why percentile and rarity become especially useful when comparing
higher IQ scores. See the full
IQ percentile and rarity chart
for score-by-score detail.
Treat an IQ Score as an Estimate, Not a Perfectly Fixed Number
IQ test results should not be interpreted as infinitely precise.
Standardized assessments commonly report a confidence interval around
the obtained score because all psychological measurement contains some
degree of measurement error.
In practical terms, two scores that differ by only a few points may not
represent a meaningful difference. The test used, its reliability,
testing conditions, age norms and other factors can all influence the
reported result.
IQ Score Chart: Frequently Asked Questions
What is the average IQ score?
The standardized average on most modern IQ scales is 100.
A score of 100 corresponds to approximately the 50th percentile.
How do I compare two IQ scores?
Compare both the numerical score and the percentile rank. For example,
IQ 100 is around the 50th percentile, IQ 115 is around the 84th
percentile and IQ 130 is around the 98th percentile on a standard
SD-15 scale.
What percentile is an IQ of 130?
An IQ of 130 is approximately at the 97.7th percentile on a scale with
a mean of 100 and standard deviation of 15.
Is an IQ of 100 average?
Yes. IQ tests are standardized so that the population mean is
approximately 100. A score near 100 is therefore at the center of the
distribution.
What is considered a high IQ score?
Classification labels vary by test, but scores of 110 and above are
above the standardized mean, while scores around 130 are approximately
two standard deviations above average on an SD-15 scale.
What is the difference between IQ 120 and IQ 130?
The numerical difference is 10 points. On an SD-15 scale, IQ 120 is
approximately at the 91st percentile, while IQ 130 is approximately at
the 98th percentile.
What is the difference between IQ 130 and IQ 140?
Both scores are far above the standardized mean, but they occupy
different points in the upper tail of the distribution. IQ 130 is
approximately at the 97.7th percentile, while IQ 140 is around the
99.6th percentile on an SD-15 scale.
Why do different IQ charts show different numbers?
IQ charts can differ because test publishers use different
classification labels, norm samples, score ceilings and, historically,
different standard deviations. Percentile rank is often more useful
when comparing scores from different scales.
Is "genius IQ" an official IQ classification?
No single universal clinical category called "genius IQ" is used
across all modern intelligence tests. The word is often used
informally for exceptionally high scores, while official
classification terminology varies by test.
Can an IQ score change over time?
Scores can vary between assessments because of development,
measurement error, practice effects, testing conditions and differences
between test instruments. Read more in our
does IQ decrease with age
guide.
Find Out Where You Land on the IQ Score Chart
Take our free IQ test for an instant score, then compare your result with
the chart and percentile lookup above.